ASC2023

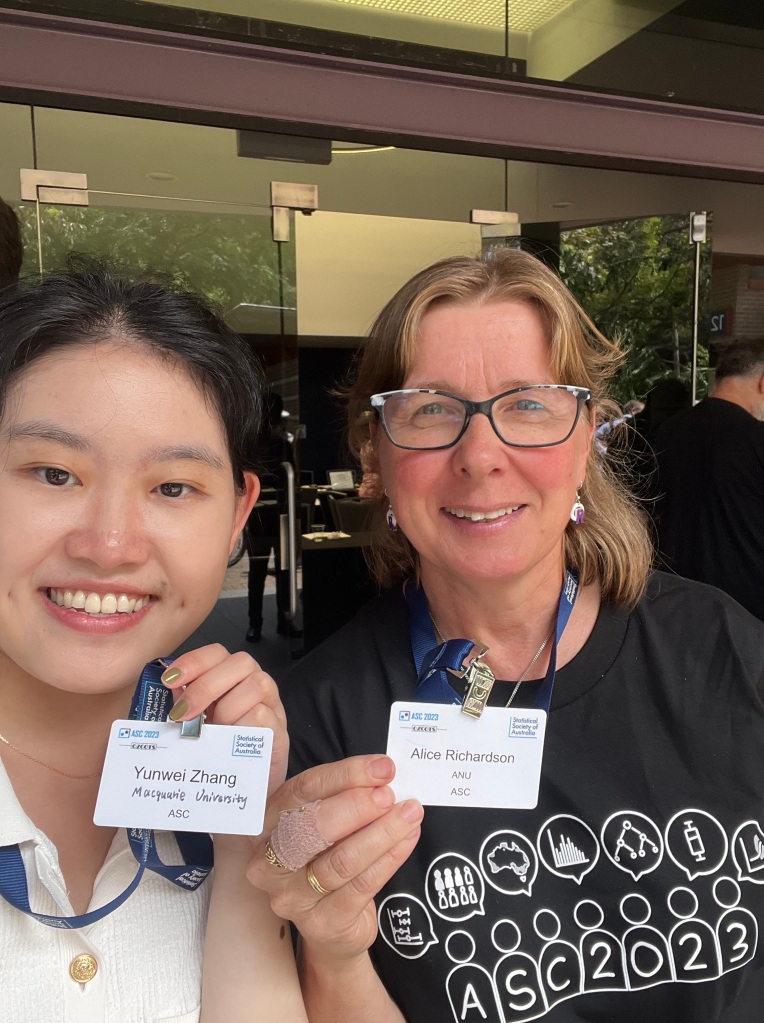
The Australian Statistical Society conference took place at the beautiful campus of the University of Wollongong, 11 – 14 December 2023. It was a great opportunity to be with my tribe for a whole week of talks, lunches, dinners, afternoon and morning teas.

My presentation was on trend estimation of sub-national level daily smoking prevalence by age and sex in Australia. This application of multilevel time series modelling in a Bayesian framework produces small domain estimates for 2352 age-sex-state-year combinations across SA3s in Australia from 2011 – 2021. The findings of the study identify the geo-demographic groups with strongest and weakest progress towards the end of tobacco smoking. This will go a long way towards helping health researchers and policymakers to deliver targeted programs to the most vulnerable.

I took the RLadies banner for a summer road trip and it made a huge difference to the RLadies exhibit!

It was cool that the Australian contingent to SAfJR met up again too.
And finally, my all-time favourite slides of the whole conference. First, the Island of Research. I’ll meet you in the Data Analysis Jungle! But please do not block my path of inquiry.

And second, the battle of Clontarf. The picture by Hugh Frazer is from 1826, was held by the Isaacs Art Center Museum and Gallery, Kamuela, Hawaii. I think it has now been purchased by Kildare Partners and was shown in Dublin, Ireland for the 100th anniversary of the battle, in 2014. I’ve seen Taya Collier use this in two presentations now, and what a clever choice it is to illustrate the potential different locations of statistical consultants in the battle that is research collaboration. Never forget that in the thick of this battle, you may actually be the King in the Tent!

Missing data and multiple imputation

The Australian Pharmaceutical Biostatistics Group bring together biostatisticians with an interest in pharma from across business, government and academia. I’m not fully across all heir activities so it was nice to be alerted to their end-of-year online event on Friday 8 December. Over a dozen people attended online like me, with more in the room in Sydney.

The speaker was Michael Fitzgerald, a Director of Statistics at Phastar, primarily working in clinical trials across a diverse range of therapeutic areas with pharma, biotech, and MedTech, while building a team of statisticians for Phastar across the Asia-Pacific region. Michael learned his trade as a statistician working on investigator-led studies while working at the University of Newcastle’s Centre for Clinical Epidemiology & Biostatistics and in the Hunter Medical Research Institute. Michael has been honing his skills in the application of advanced missing data techniques over the past 12 years while working on late-phase trials, which has become particularly important with the rise of the estimands framework and expectations of more robust sensitivity analysis from regulators and sponsors. You can find him on Github at mickfitz.

This presentation was based around a case using simulated data and a SAS analysis based on a real study where the primary endpoint was recurrent event data. The planned analysis was a negative binomial model of the counts with region and treatment as covariates and time-at-risk as an offset. Michael described the missing data strategy for the primary analysis and sensitivity analyses , plus a bonus method using multiple imputation and pattern mixture models for a tipping-point analysis. Michael also provided a couple of useful links for those wanting to take the ideas further: Statistics Globe and the LSHTM.


Using linked administrative data to inform occupational and environmental health policy in British Columbia, Canada

Professor Chris McLeod was visiting NCEPH an and on Friday 1 December he gave this special seminar. I Zoomed in with another twenty or so people online, along with however many in person.

British Columbia is blessed with a rich set of linked administrative data ranging from health to work and income, environmental, social and demographic sources. This enables researchers to tackle interest groups questions such as the ones Chris reported on, such as changes in mesothelioma diagnosis and outcomes over time.

I was also interested in the use of linked data for intervention research, and some comparisons that Chris and colleagues have done between Australian states and Canadian provinces.

Chris has even been getting into using the linked data for heat-related illness among workers, which has direct links to some other hear-related health outcomes research I’m about to start.

So altogether for the first day of the lead-up to Christmas, this talk provided a number of leads for summer projects!